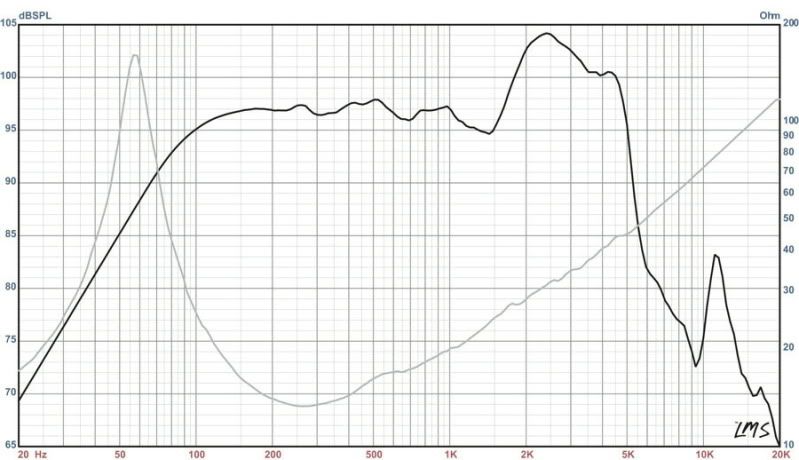
Take this example. It's the frequency response and impedance curve of the Eminence Delta-12B:

The black line is frequency response, the gray is impedance.
Note how it starts out low, rises quickly to a peak around 57-58Hz, falls rapidly to a low around 250Hz, then rises again through the rest of the audible range. This is very typical shape. The actual values and frequencies will change, but the shape is usually a lot like this.
That first peak is the resonant frequency, or Fs. The low is what is often called minimum impedance, in this case around 14 ohms. From this graph, I'd say without hesitation that this is a 16 ohm driver, even though it's at 16 ohms in only two places. The point here is that the DC resistance, the nominal impedance, and the actual impedance can be very different things, and that yes, your DC measurements are normal for 8 ohm drivers.